Mutual Fund |
July 09, 2021Significance of ratios for mutual funds
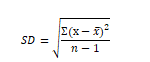
Here, is the mean of returns, n is the number of returns, and x refers to each individual return. The operator denotes sum. Thus, to calculate standard deviation we subtract each return from its mean, square the deviations and sum them up. Then we divide them by the total number of returns less one, and square root the result. Let’s understand why we use standard deviation.
Standard deviation is a measure of the distribution of a dataset in relation to its mean. Since all funds provide us with mean returns over a period, standard deviation is helpful in measuring the volatility of a fund. A higher standard deviation indicates that the fund’s price tends to fluctuate more, indicating unpredictability of returns. This unpredictability is taken as a proxy for risk in the market, making standard deviation an important metric to judge riskiness of investments.
It is important to note that high or low standard deviation does not necessarily make a good or bad investment. All else constant, lower standard deviation indicates greater consistency of returns, but people who have a higher risk appetite might choose to go with funds that have slightly higher standard deviations. The choice depends entirely on the risk profile of the investor. Also, it must be kept in mind that standard deviation must not be studied in isolation. Because it measures volatility around the mean returns, studying the mean returns themselves is also important before picking the mutual fund that is right for you.
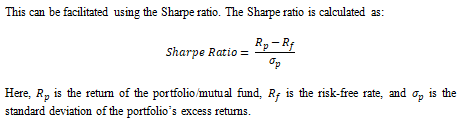
The purpose of the Sharpe ratio is to provide a measure that integrates risk and return. By adjusting the portfolio’s excess returns by its standard deviation, it essentially measures the returns a fund can generate for every unit of risk that it takes. A higher Sharpe Ratio is always desirable as it indicates that the fund is generating higher returns by taking lower risk.
Another important measure of risk is the Beta of a mutual fund.
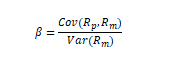
Thus, it is calculated by dividing the covariance of a portfolio’s returns with the market/benchmark returns, divided by the variance of the market/benchmark returns.
The purpose of beta is to track the volatility of your investment with relation to the market. The beta is centered around 1 as the market has a beta of 1. Thus, a portfolio with a beta higher than 1 is more volatile than the average market, while a beta lesser than 1 indicates lower-than-market volatility. Let’s take an example. Suppose a mutual fund has a beta of 1.15. This indicates that for every 1 point of deviation in the market, we expect the mutual fund’s value to change by 1.15 points. Thus, it is a fund which is riskier than the market.
Much like standard deviation, we cannot establish a thumb rule as to whether a high or low beta is desirable. The beta is merely a measure of risk. Higher betas raise the expected return of an investment as the fund manager is taking on more risk, while lower betas indicate safer investments.
The final ratio we will discuss is alpha.
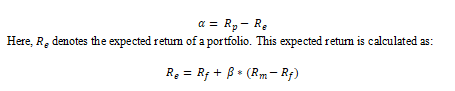
Alpha measures the excess returns a fund is generating as compared to its expected return, based on its beta. For example, an alpha of 3% indicates that the fund is generating 3% more returns than it is expected to, based on the riskiness of its investments. It is taken as a valuable measure of the quality of a fund and particularly its fund manager. We look for higher alphas as they indicate that the fund can generate market-beating returns.
Finally, investors must keep in mind that ratios must be tracked over time. Consistency across them is important. For example, a fund with a positive alpha currently but with negative alphas in previous periods is something that must be treated with caution. So go ahead, study the ratios of your mutual funds, and decide what’s best for you based on your own risk profile.